Using Azure Application Insights SDK with PowerShell
Azure Application Insights is Microsoft’s Application Performance Monitoring (APM) service built on top of Azure Monitor. Unfortunately, PowerShell is not one of the officially supported languages for the Application Insights SDK. But, it does work, and is actually pretty simple to set up.
Why you want Azure Application Insights monitoring your applications
The main benefit of any APM is to provide visibility into metrics that are meaningful for application developer and DevOps teams. This goes beyond traditional monitoring of system resources such as CPU, memory, and disk utilization. It can provide actionable information on error codes, automatically detect performance anomalies, and allows for custom telemetry and exception tracking. This is accomplished through the use of a SDK, with which you add a small bit of code to your application, or an agent to the platform running your application, and it will collect performance and telemetry data about your application. Learn more about Application Insights in Microsoft’s Azure Monitor Documentation.
Create Azure Application Insights resource
Follow the Microsoft Documentation guide to create an Application Insights resource within your Azure Subscription.
If you already have an Application Insights resource that you would like to use to monitor your PowerShell code, then just copy the Instrumentation Key for later use.
Azure Application Insights SDK with PowerShell

Luckily, PowerShell is built on top of .NET and written primarily in C#, so we can easily leverage the Application Insights .NET SDK for monitoring our PowerShell code (in Azure Functions, Azure Automation, a Windows or Linux VM, or anywhere PowerShell can run!).
Download and extract the .NET SDK from NuGet
NuGet, the package manager for .NET, allows you to import external packages into .NET projects such as C# applications. The Azure Application Insights .NET SDK can be downloaded directly from NuGet.org as a .nupkg file, which can either be imported into Visual Studio for use in a .NET project, or can be extracted like an archive (think .zip) file to expose the underlying .dll files that are used to interact with Application Insights. As we are going to be using the .dll files with PowerShell, we will extract the .nupkg file.
Download microsoft.applicationinsights.nupkg from NuGet.org.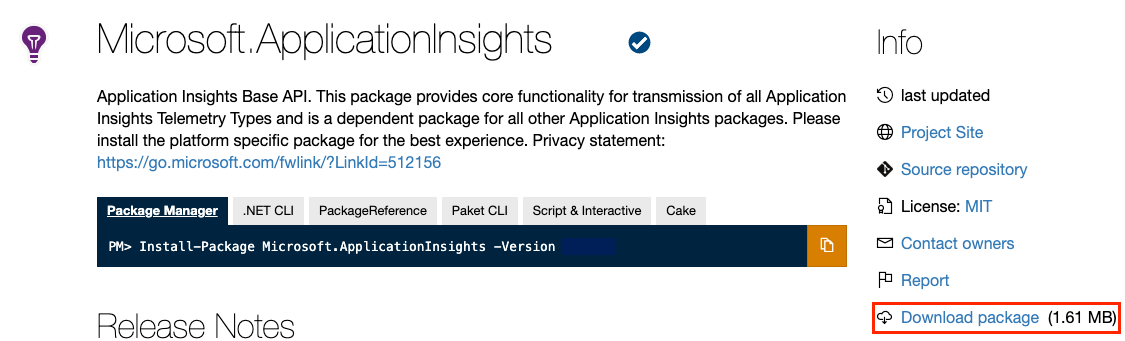
Expand the .nupkg archive using PowerShell
# The current version at the time of writing is 2.18.0,
# update the version number to match the file you downloaded
Expand-Archive -Path ./microsoft.applicationinsights.2.18.0.nupkg -Force
Open the directory that was created from the extracted file, and then open its lib/ directory. Within lib/, there are multiple directories containing the Application Insights SDK for different versions of .NET. If you are going to be using PowerShell 7 on Azure Functions like me, then you will want Microsoft.ApplicationInsights.dll from the net452/ folder.
Add the Application Insights SDK to a PowerShell Azure Functions Project
If you already have a PowerShell Azure Functions Project that you want to add Application Insights custom telemetry and exception handling to, then you just need to add the Microsoft.ApplicationInsights.dll file to the same directory as your function’s run.ps1 file.
If not, follow the steps in the Microsoft Documentation to create a PowerShell Azure Function App using VS Code, then add the Microsoft.ApplicationInsights.dll file to the same directory as your function’s run.ps1 file.
Connect Application Insights to PowerShell code
Add the following commands to the top of your PowerShell code:
# Load .dll assembly into PowerShell session
[Reflection.Assembly]::LoadFile("$PSScriptRoot\Microsoft.ApplicationInsights.dll")

# Instantiate a new TelemetryClient
$TelemetryClient = [Microsoft.ApplicationInsights.TelemetryClient]::new()

# Set the Application Insights Instrumentation Key
$TelemetryClient.InstrumentationKey = '<AppInsights Instrumentation Key>'
Alternatively, you can add the Instrumentation Key as an Azure Key Vault Secret, which prevents the exposure of the Instrumentation Key. You can reference the Key Vault Secret within your PowerShell Function, assuming that you have granted access for your Function App’s Managed Identity to get secrets from the Key Vault.
To get an Azure Key Vault Secret using PowerShell, add the following command to your code:
$InstrumentationKey = Get-AzKeyVaultSecret -Name 'SecretName' -VaultName 'KeyVaultName' -AsPlainTextYou can then reference the retrieved Secret for use in the Application Insights SDK’s telemetry client:
# Get the Instrumentation Key from Azure Key Vault
$InstrumentationKey = Get-AzKeyVaultSecret -Name 'SecretName' -VaultName 'KeyVaultName' -AsPlainText
# Set the Application Insights Instrumentation Key
$TelemetryClient.InstrumentationKey = $InstrumentationKey
Generate custom telemetry event
Whenever you want to generate a custom telemetry event that will be sent to Application Insights, add the following commands to your code:
# Generate a custom event
$TelemetryClient.TrackEvent('This is my custom AppInsights telemetry')
$TelemetryClient.Flush()
Generate a custom exception event
You can also generate custom exceptions which are tracked within the Exceptions area of Application Insights by adding the following command to your code:
# Generate a custom exception
$TelemetryClient.TrackException('This is my custom AppInsights exception')
$TelemetryClient.Flush()
This functionality is perfect for use within a try/catch block:
try {
    # Throw an exception
    0/0
} catch {
    # Record the caught exception
    $TelemetryClient.TrackException($_.Exception)
    $TelemetryClient.Flush()
}
View the custom events within Application Insights
Within the Azure Portal, navigate to the Application Insights resource that you have connected to your PowerShell code. Then, navigate to the Logs blade under the Monitoring group.
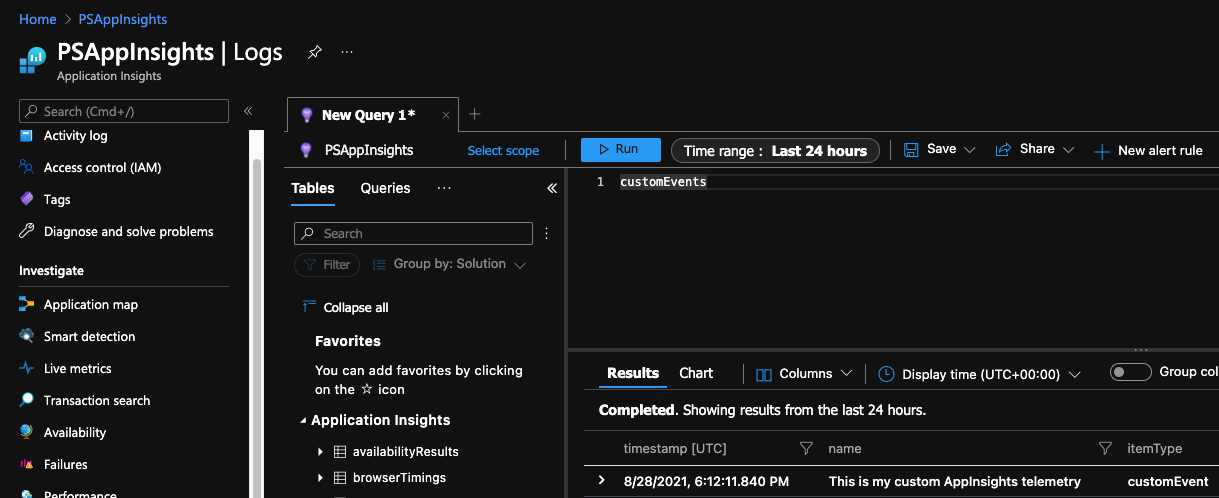
View custom telemetry events
Within the Kusto Query Language (KQL) query window, type customEvents and click Run. This will show the custom telemetry events that your PowerShell code has generated.
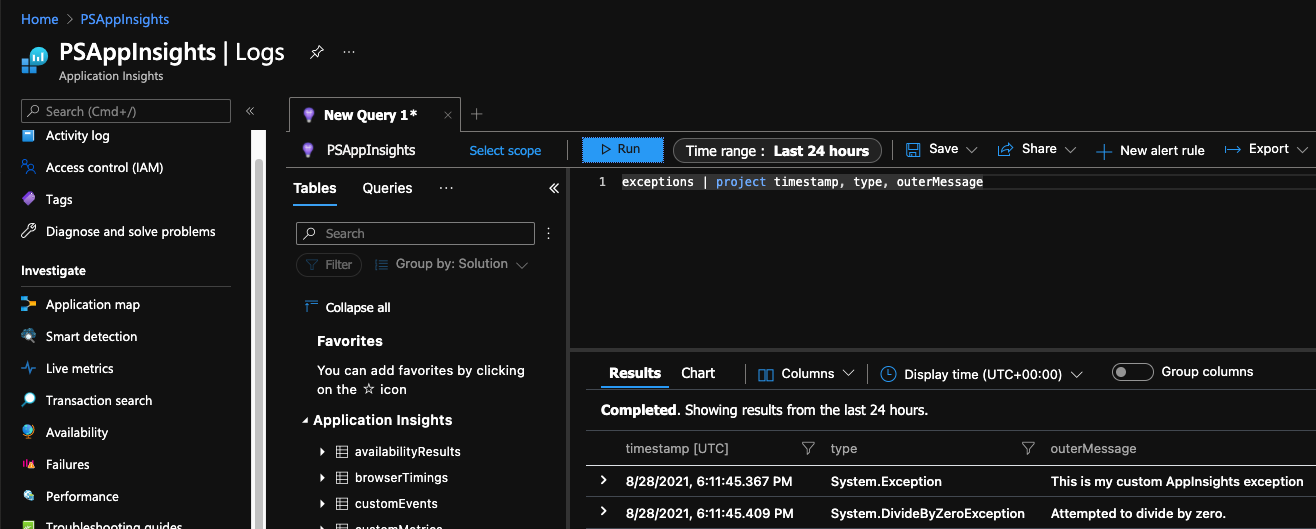
View custom exception events
Within the Kusto Query Language (KQL) query window, type exceptions and click Run. This will show the custom exception events that your PowerShell code has generated. You can see the two exceptions that were demonstrated above, one that is a custom message and one that is a caught exception from a try/catch block.